
Invoices
Invoices for Grafana Cloud services can be reviewed in the Grafana Cloud account portal. From the menu on the left side of the page, navigate to the Billing > Invoice history section. Invoice details can be downloaded as a PDF or CSV file. Refer to the Plan details page to determine your plan type and terms. If you subscribe to Grafana Cloud through a marketplace provider, such as AWS, Azure, or Google Cloud Platform, refer to your cloud service provider account portal for invoice details.
Refer to the Reconcile invoices page for more details about reconciling invoices with the billing dashboard.
For detailed information about user activity, refer to Usage Insights dashboards.
To learn more about how billing calculations are performed, refer to the following topics:
- Understand contract frameworks and pricing terms
- Reconcile your Grafana Cloud invoices
- Understand Grafana Cloud usage limits
- Understand your Grafana Users invoice
- Understand your Synthetic Monitoring invoice
- Understand your Grafana Cloud IRM invoice
- Understand your k6 invoice
- Understand your Grafana Cloud Metrics invoice
- Understand your Grafana Cloud Logs invoice
- Understand your Grafana Cloud Traces invoice
Billing and Usage dashboard
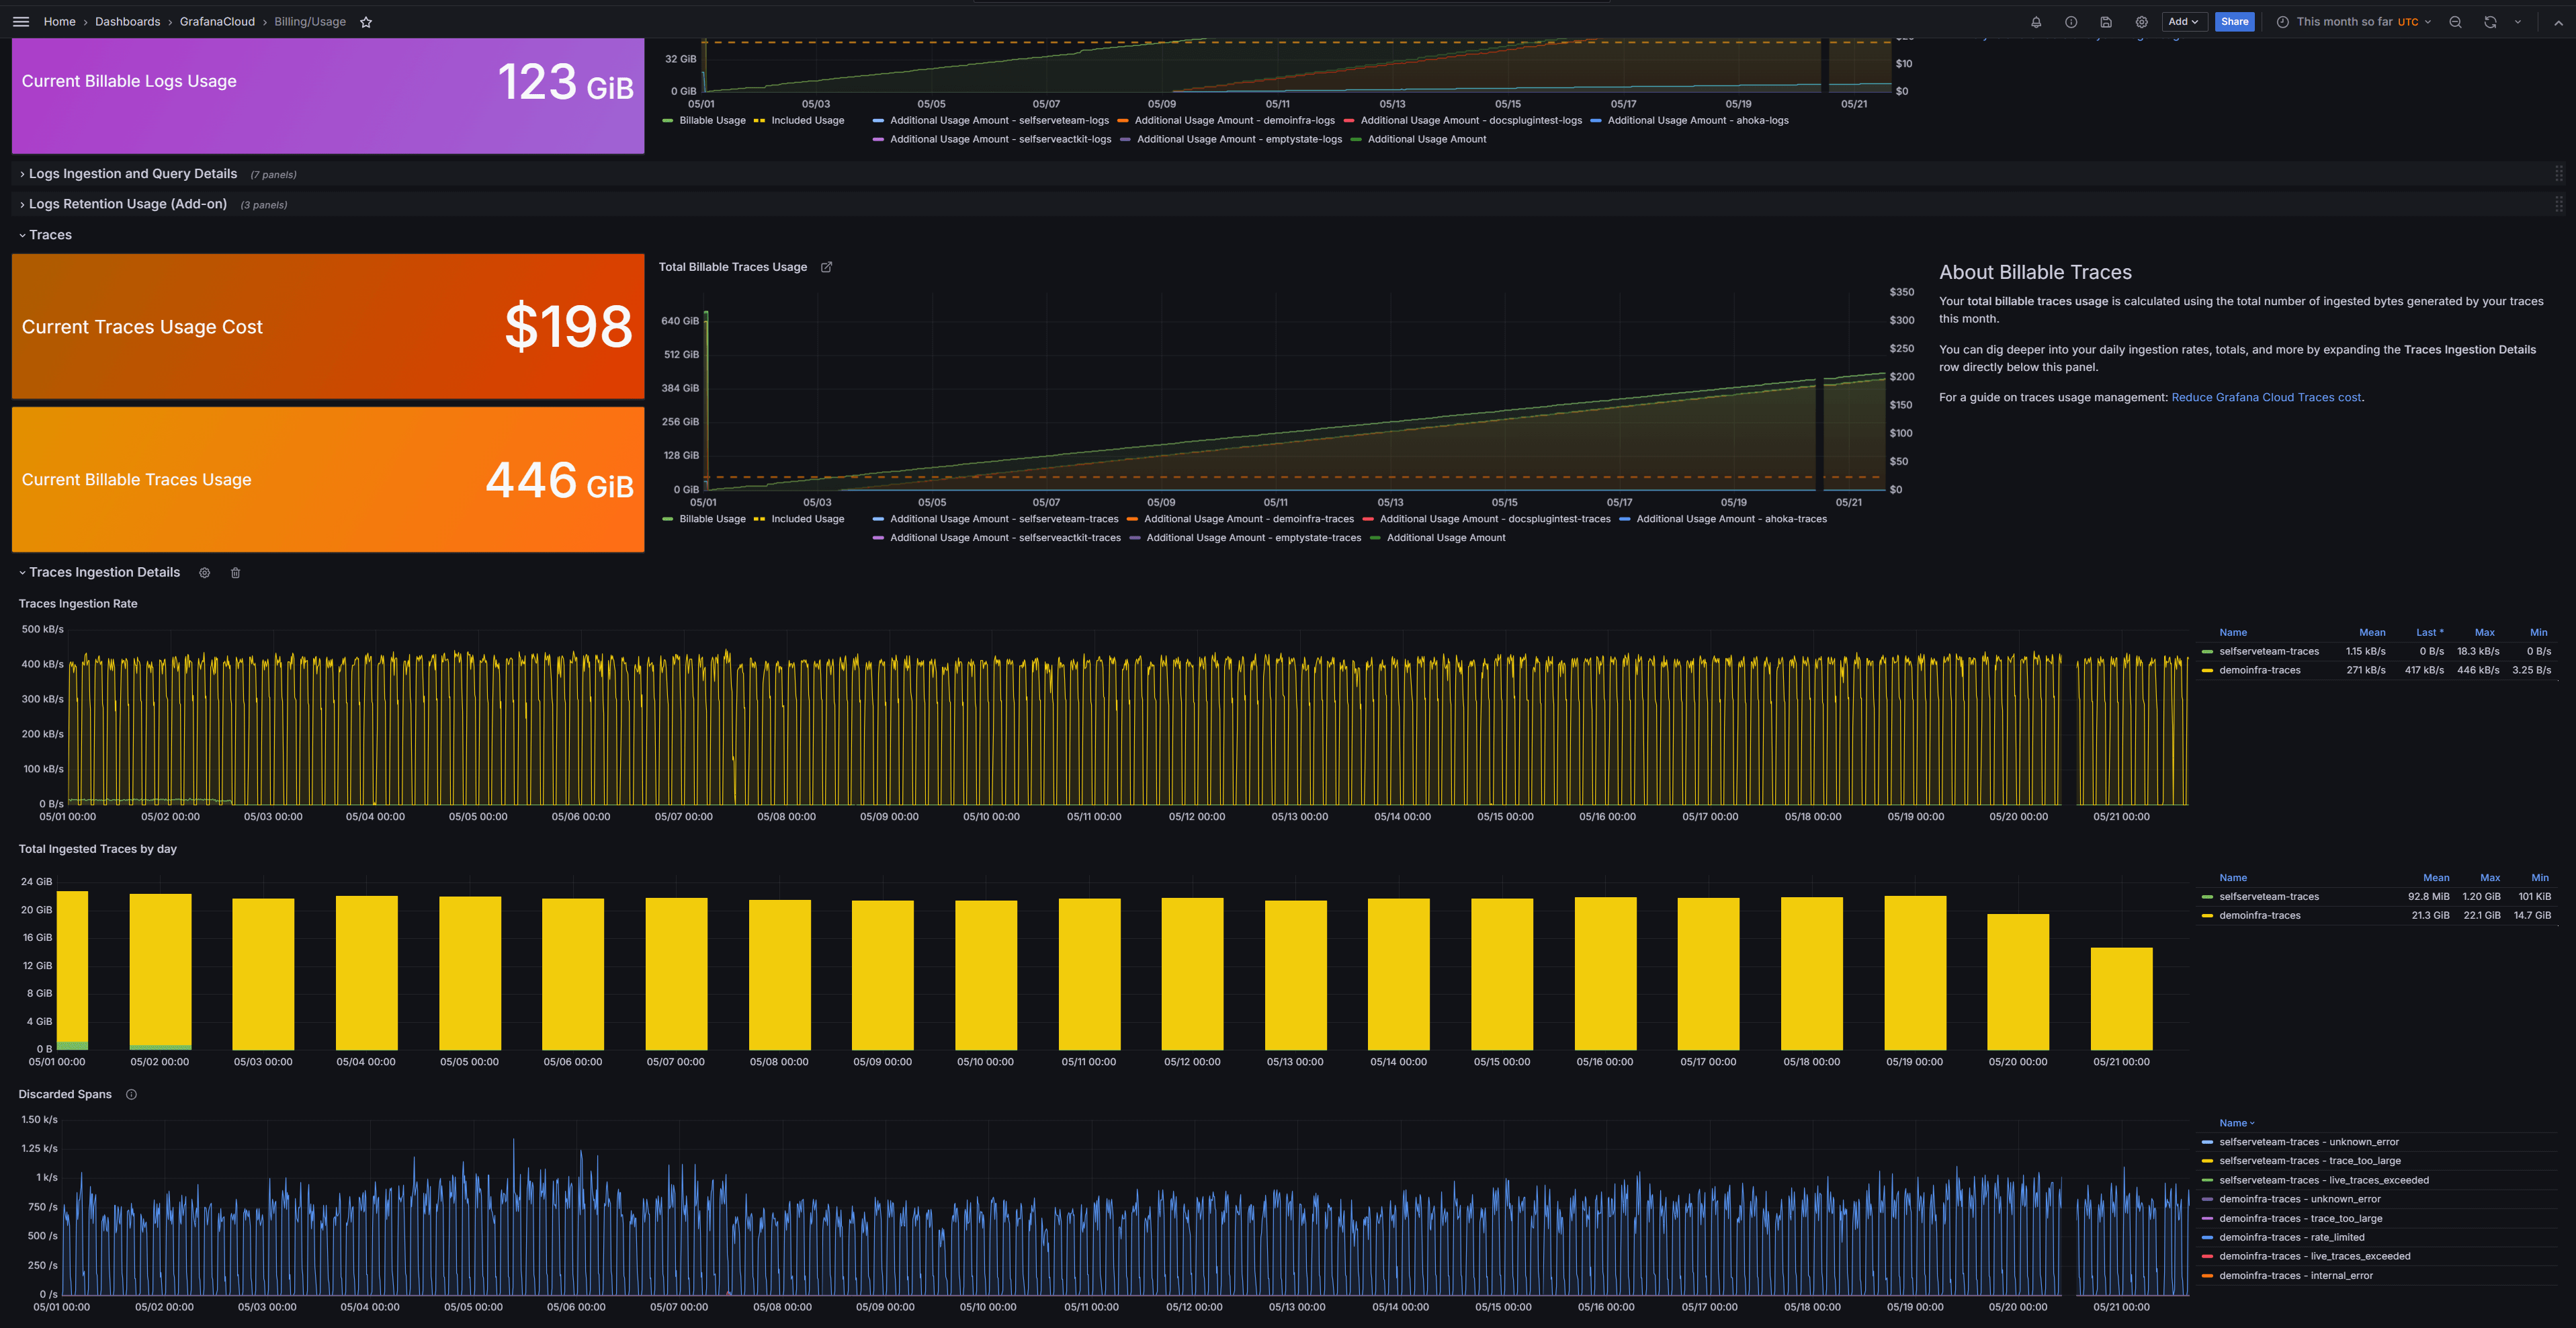
Detailed activity for monthly usage and estimated billable cost is available on the Billing/Usage dashboard located in the GrafanaCloud dashboard folder. These details can also be reviewed in the Grafana Cloud account portal under Billing > Current usage.
Cost estimates are displayed on the Stat panels located on the left side of the dashboard. Text panels are located on the right side of the dashboard to describe how billing calculations are performed. Time series panels are displayed in the middle of the dashboard to show billable usage for the current month so far.

Additional panels are available by expanding the row for each product type. For example, to review traces ingestion rate, total ingested traces by day, and discarded spans, expand the Traces Ingestion Details row to display panels visualizing this information.
The dashboard duration is set to “This month so far” by default. Use the time picker located at the top right of the dashboard to select a different time range if needed. Since billing calculations are based on the calendar month, selecting the dates or using the options for “Previous month” is often more useful than choosing the option for “last 30 days” to align with the billing cycle.

Set an email to receive billing invoices
To receive billing invoices:
Navigate to your Cloud portal at grafana.com.
From the menu on the left, click Members.
Click Update for the member who should receive invoices.
In the pop-up that appears, use the dropdown menu to set Receive billing email to Yes and click Update Membership.
Note
If you subscribe to Grafana Cloud through a marketplace provider, such as AWS, Azure, or Google Cloud Platform, you must configure billing notifications within your cloud service provider portal instead of the Grafana Cloud account portal.
Common billing questions
Answers to common billing questions are provided below.
What are active series?
An active series is a time series that receives new data points or samples. When you stop writing new data points to a time series, shortly afterwards it is no longer considered active. To learn more, go to active series.
What is DPM?
Data points per minute (DPM) represent a single measured occurrence, or sample, of a metric within a time series, consisting of a unique value and timestamp. Visit our documentation on DPM to learn more.
What is VUH?
A k6 Virtual User hour (VUH) is a user or thread emulated during a k6 test, rounded up to the next minute. Visit the k6 billing documentation to learn more.
When does the billing cycle begin?
Usage is calculated per calendar month. The Billing/Usage dashboard displays estimates based on usage for this month so far.
Will I be billed during my 14-day unlimited usage trial?
No, trial usage is never billed. Once the trial completes, the account will automatically update to the Grafana Cloud Free plan.
Why do the Total Billable Series not decrease after I have reduced active series?
The Total Billable Metrics Series panel displays the 95th percentile of the total number of active series sent and the total DPM across all active series.
Billing that is based on the 95th percentile of usage prevents costs for unexpected or temporary usage spikes and forgives the top five percent of usage time in each calendar month, which is roughly the top ~36 hours of usage (0.05*720 = 36).
When metrics usage remains at a high volume for longer than 36 hours, this becomes the projected billable metric series amount. Therefore, reducing metrics usage will not greatly adjust the 95th percentile for the current calendar month.
To learn more, refer to Understand active series and DPM for billing calculations.
Why is Billable series higher than Active series?
The reflection of your billable series can appear to lag for up to a month due to how billable monthly usage for metrics is calculated. To determine if recent changes will result in reduced costs for next month’s invoice, refer to your active series panels rather than your billable series panel.
Billable series are determined by:
- The number of active series, which is the number of unique metric series
- The number of data points per minute (DPM), which is how frequently the data is being sent to Grafana Cloud
Usage is defined as the maximum of either active series or DPM:
usage = max(active_series, total_dpm/1)
It is recommended to use a 1-minute DPM as the global default and only increasing the scrape interval per job as needed for more graph resolution. Refer to Reduce metrics costs by adjusting your data points per minute (DPM).
Why aren’t the Cardinality Management dashboards displaying data?
The Cardinality Management dashboards visualize how metric names and labels are distributed across the time series data sent to Grafana Cloud. The dashboards queries reference the last two hours of ingested metrics. If you do not see any data displayed on the Cardinality Management dashboards, it is likely because no data has been received within the last two hours. To learn more, refer to Analyze metrics usage with cardinality management dashboards.
Was this page helpful?
Related resources from Grafana Labs


