

Grafana Cloud updates: revamped Synthetic Monitoring, improvements to Kubernetes Monitoring, and more
We consistently release helpful updates and fun features in Grafana Cloud, our fully managed observability platform powered by the open source Grafana LGTM Stack (Loki for logs, Grafana for visualization, Tempo for traces, and Mimir for metrics).
In case you missed it, here’s a roundup of the latest and greatest updates for Grafana Cloud this month. You can also read about all the features we add to Grafana Cloud in our What’s New in Grafana Cloud documentation.
And if you’re not a Grafana Cloud user… what are we waiting for? You can try any of these features for free with our generous Cloud Free plan. Sign up for an account today!
Synthetic Monitoring enhancements
We announced a major update to our Synthetic Monitoring product to help you proactively monitor the performance of your APIs and web applications from the user’s perspective.
Traditionally, Synthetic Monitoring used the Prometheus blackbox exporter to test at the protocol level: HTTP, DNS, TCP, gRPC, and ICMP (for ping and traceroute). This worked well for health and uptime monitoring, but it’s important to also test beyond single endpoints and dig into complex transactions and critical user journeys.
This was the motivation behind our revamped Grafana Cloud Synthetic Monitoring offering, powered by Grafana k6. We now offer two new check types to expand your test coverage and increase confidence in your applications:
- MultiHTTP checks (generally available): A form-based approach for defining multi-step tests. Under the hood, the form generates a k6 script, so you don’t have to write code.
- k6 Scripted checks (public preview): Gives you the power and flexibility to define your workflow tests in JavaScript, using the k6 API to efficiently author tests.
You can also use these k6 scripts in other parts of the development lifecycle, which eliminates the need for teams to maintain separate testing scenarios, and improves collaboration and efficiency. For example, the same script used for Synthetic Monitoring can be used by developers in a CI pipeline, or by a testing center of excellence to run automated functional tests.
To learn more, check out our Synthetic Monitoring announcement blog post.
Kubernetes Monitoring: all the latest updates
We’ve been busy adding new capabilities to Kubernetes Monitoring in Grafana Cloud, helping you more efficiently track and analyze the health of your Kubernetes environment.
User experience improvements
You can now control the automatic refresh interval of the GUI, as well as disable auto refresh until you are ready to do so manually. This feature is particularly useful for large Kubernetes fleets that display a lot of data.

Access alert rules from a list item
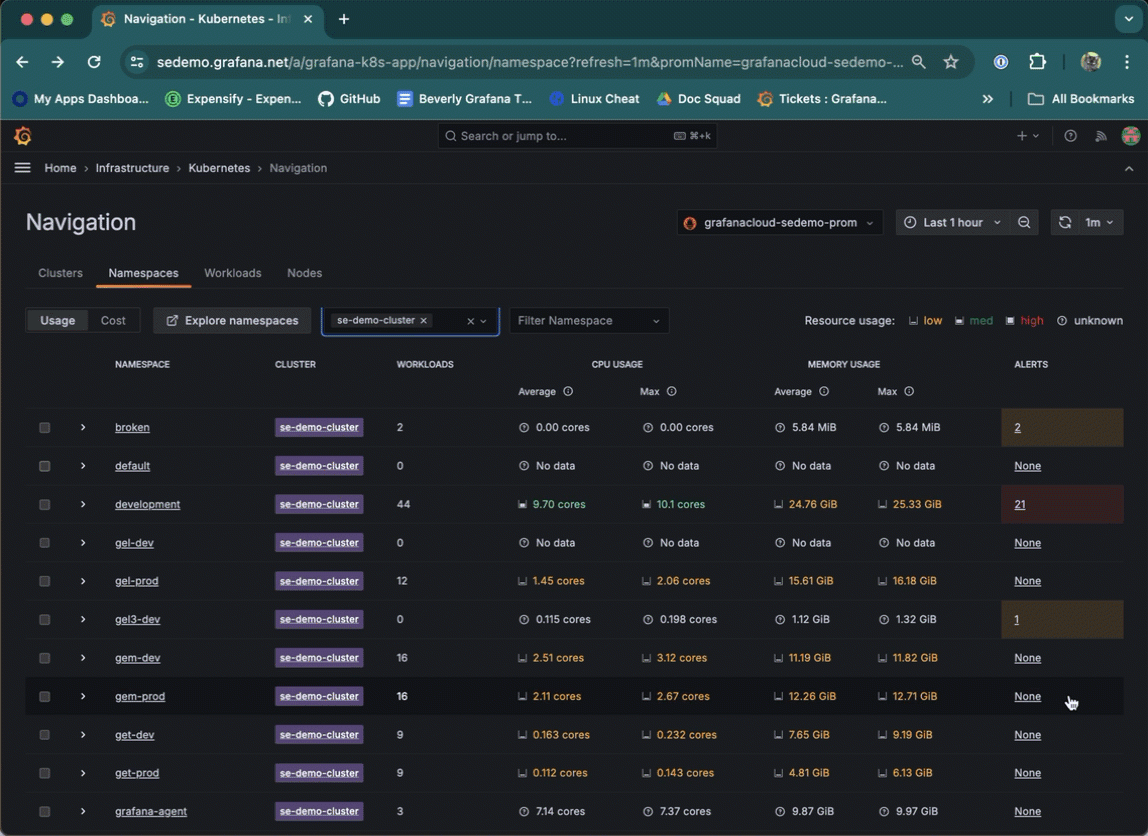
It’s now possible to navigate to the Alert rules page from a list item on a cluster, namespace, node, pod, or container list. To do so, click the underlined alert number next to the list item.
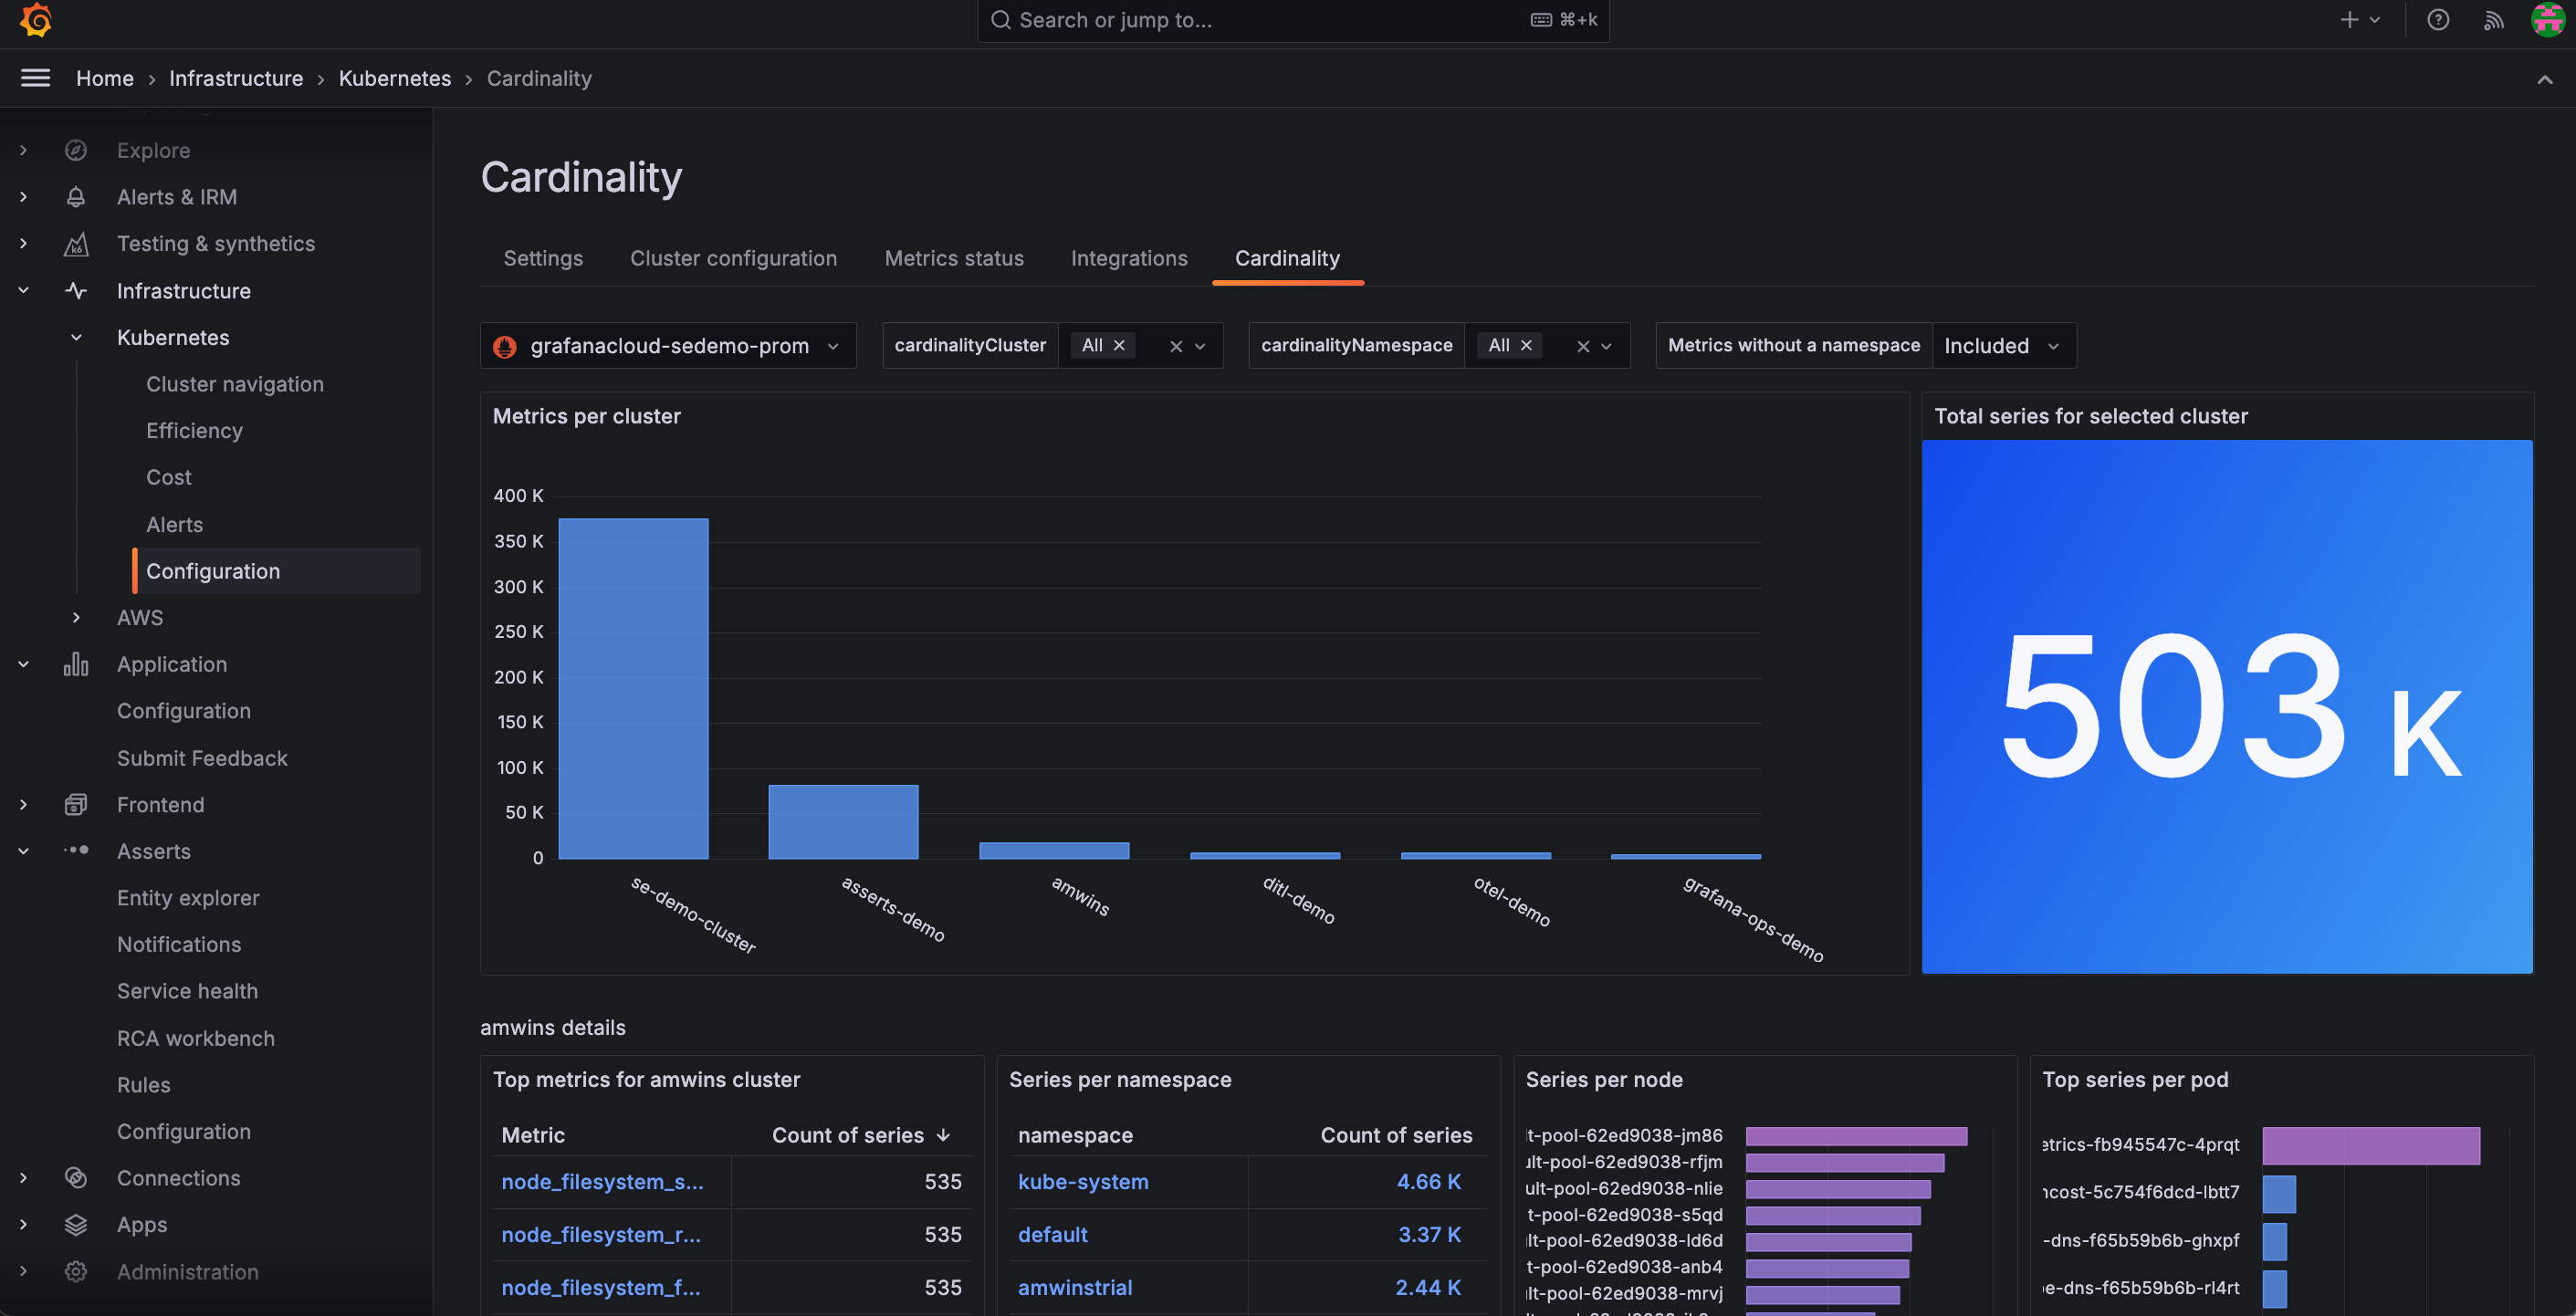
Manage metrics in the Cardinality page
Use the in-app Cardinality page to discover, on a cluster-by-cluster basis, where your active series are coming from. This can help you identify unnecessary or duplicate metrics, along with other potential cardinality issues.
Filter for pod types
You can now filter by pod type on the Workloads list page to find static pods and bare/unmanaged pods.

Begin a Sift investigation
Sift is a powerful diagnostic assistant, powered by Grafana Machine Learning, that can perform investigations on your infrastructure telemetry. In Kubernetes Monitoring, you can now begin an incident investigation by clicking Run Sift investigation from the pod, cluster, namespace, or workload view.
To learn more about all the latest updates to Kubernetes Monitoring in Grafana Cloud, check out our technical documentation.
View SLO performance by team and service
Grafana SLO (Service Level Objective) provides a framework to measure the quality of service you provide to users. Now, the SLO Performance page provides a view that lets you filter to see exactly how your team and service SLOs are performing. This is especially helpful for customers with a large number of SLOs who would like to view a logical subset. To get started, tag your SLOs with the team_name and/or service_name labels.
To read more about Grafana SLO, refer to our technical docs.
RBAC for alert rule provisioning APIs
The Alerting Provisioning HTTP API has been updated to enforce Role-Based Access Control (RBAC). In Grafana Cloud, users with the role Rules Writer and Set Provisioning status can access the API and limit access to alert rules that use a particular data source.
New Grafana Cloud integrations
- Velero. You can now easily monitor Velero, an open source tool that helps backup and migrate Kubernetes cluster resources and persistent volumes, in Grafana Cloud. This integration includes four useful alerts and three pre-built dashboards for your backups, snapshots, and cluster views.
- OpenLDAP. We’ve added a new integration for the open source implementation of the Lightweight Directory Access Protocol (LDAP) that includes four useful alerts and two prebuilt dashboards to help you monitor your OpenLDAP metrics and logs.
- More Kubernetes integrations. We’ve added Kubernetes support to the TensorFlow, OracleDB, Microsoft SQL Server, and Istio integrations.
Grafana Cloud is the easiest way to get started with metrics, logs, traces, dashboards, and more. We have a generous forever-free tier and plans for every use case. Sign up for free now!


